Correlations Between Volatility Indices and Player Metrics Emerge in Global Gaming Platforms
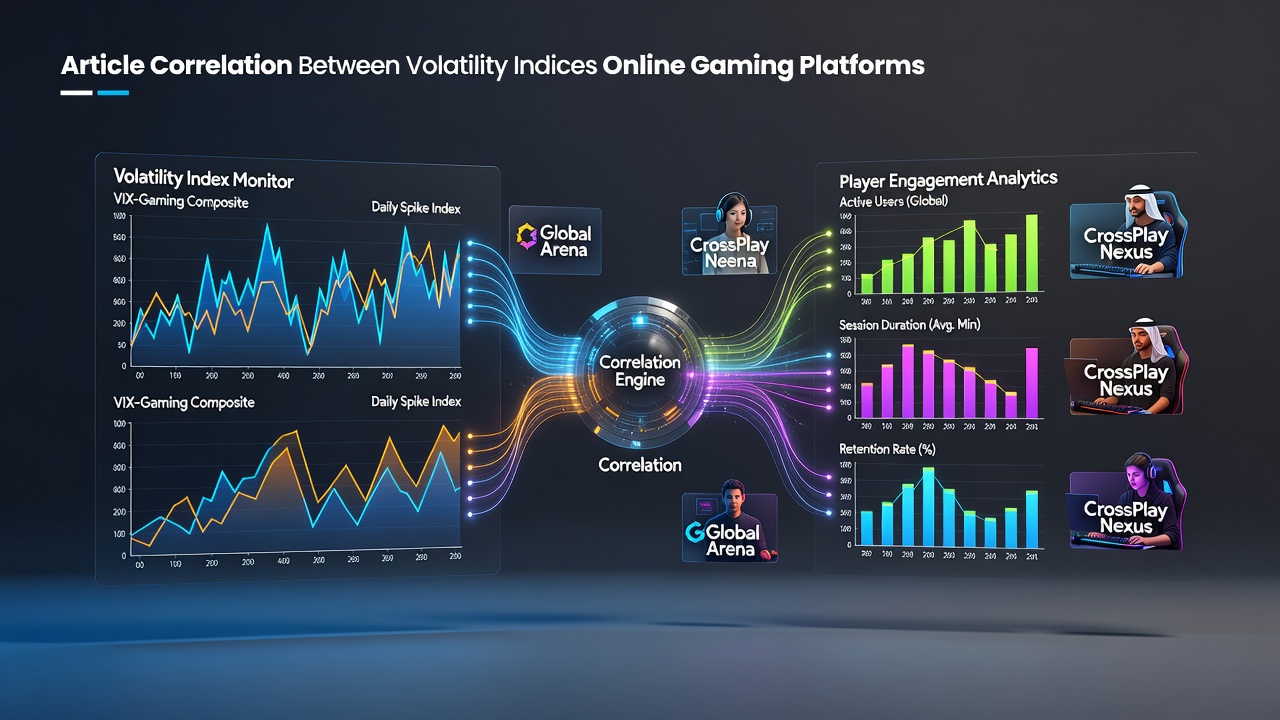
Volatility indices measure the frequency and size of wins in online gaming titles, while player engagement metrics track session duration, repeat visits, and interaction rates across platforms worldwide. Researchers have examined these elements together in recent years because patterns appear when high-volatility games draw certain player groups more than others. Data from multiple markets indicate that engagement often rises with moderate volatility levels rather than extreme swings, although regional differences create varied outcomes.
Defining Volatility Indices in Gaming Contexts
Volatility indices classify games by payout distribution patterns, with low-volatility options delivering frequent small returns and high-volatility ones producing larger but rarer payouts. Gaming operators calculate these indices using historical spin data and mathematical models that account for return-to-player percentages alongside payout variance. In July 2026, several international platforms reported updated volatility ratings for new releases, which allowed analysts to compare engagement before and after adjustments.
These ratings help categorize titles across European, Asian, and North American markets, where operators adjust game libraries based on local preferences. Studies from academic institutions show that players in high-stakes regions often gravitate toward medium-volatility games that balance risk and reward over extended sessions.
Player Engagement Metrics and Measurement Approaches
Engagement metrics include average session length, daily active users, and retention rates measured over 30-day periods. Platforms collect this information through anonymized user logs that reveal how long individuals interact with specific game types. According to reports from the Alcohol and Gaming Commission of Ontario, engagement data from Canadian operators demonstrates clear links between volatility settings and time spent per session.
Additional indicators such as bonus round participation and feature activation rates provide further detail on how volatility affects behavior. Observers note that high-volatility titles sometimes increase short bursts of activity but reduce overall repeat visits when compared to steadier options.
Observed Correlations Across International Markets
Analysis of platform data reveals that volatility levels correlate with engagement in consistent ways across borders. Medium-volatility games frequently show higher average session times because they maintain player interest without long dry spells. In contrast, high-volatility titles attract players seeking big wins yet produce more variable retention figures depending on market maturity.
One study from the University of Macau examined Asian platforms and found that volatility adjustments led to measurable shifts in daily active users during promotional periods. European operators reported similar trends where volatility tweaks coincided with changes in repeat visit rates. These patterns hold across different regulatory environments because the underlying mathematics of payout distribution remains constant.

Regional Variations and Data Patterns
Markets in Asia-Pacific regions display stronger engagement with high-volatility games during festival seasons, while North American platforms see steadier interaction with lower-volatility options year-round. Australian regulatory data collected in mid-2026 highlighted how volatility preferences shift with player demographics, with younger users showing greater tolerance for variance. European figures indicate that cross-border players often select volatility levels based on prior experience rather than local trends.
Operators use segmentation tools to match volatility offerings to these regional habits, which helps sustain engagement metrics over time. Evidence from industry reports shows that platforms offering a mix of volatility categories achieve more balanced engagement across user cohorts.
Platform Strategies Informed by Correlation Findings
Operators apply correlation insights when curating game libraries and designing promotional campaigns. They monitor how volatility changes affect key metrics such as session frequency and feature usage rates. In July 2026, several major platforms introduced volatility filters that let users select preferred risk levels, which produced measurable lifts in engagement for those who used the tools.
These approaches draw on data from multiple sources including the Australian Gambling Research Centre and university-led analyses that track long-term behavior patterns. The resulting strategies focus on aligning volatility offerings with observed engagement trends rather than uniform global settings.
Conclusion
Correlations between volatility indices and engagement metrics continue to shape decisions on international gaming platforms. Data collected through 2026 demonstrates that moderate volatility levels often support longer sessions and stronger retention across diverse markets. Operators who track these relationships maintain game selections that respond to regional and demographic patterns while preserving overall platform performance. Ongoing analysis of payout variance and user behavior will likely refine these connections further as new titles and measurement tools emerge.